Trends Reports
The trends reports (one each for Distributions, Donations, and Purchases) give you a picture of the activity on any Item over the last 12 months.
The examples below will use the Distributions - Trends report, but everything is basically the same for Donations- Trends and Purchases - Trends.
Please note that the levels for these reports may be up to 24 hours old – we generate the overnight because it would be a very slow report otherwise.
Navigation
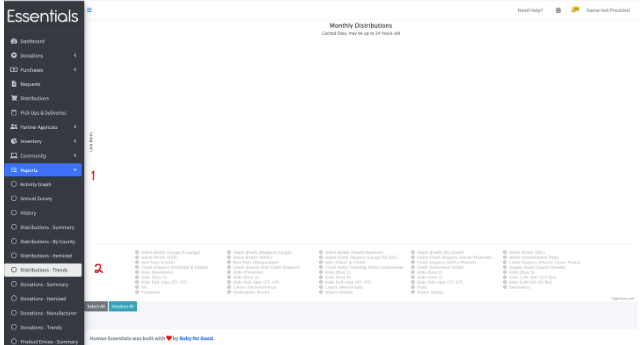
To bring up the Distributions - Trends Report, click on “Reports”, then “Distributions - Trends”
This will bring up a blank “Monthly” Distributions report, like so:
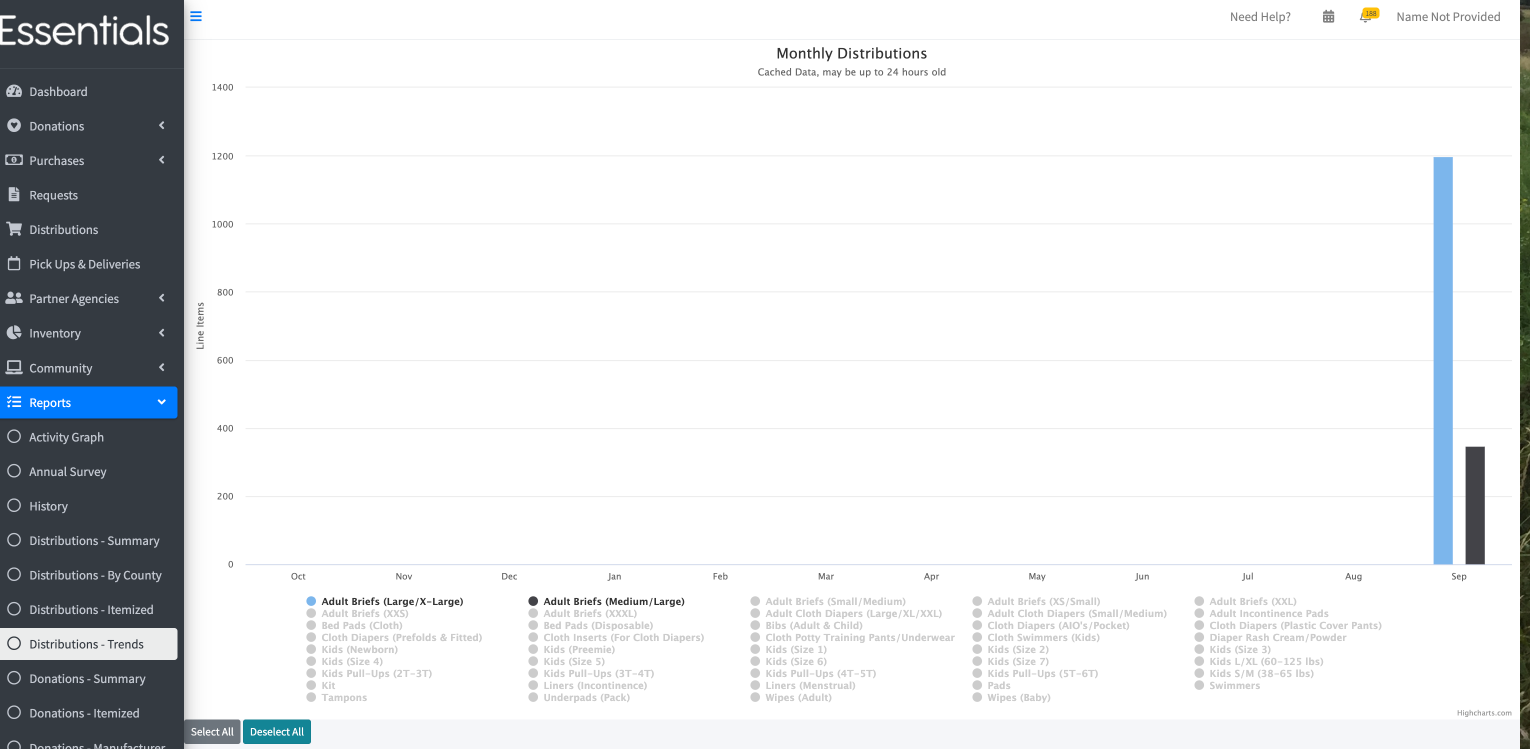
To see the activity on a particular Item, click on that Item. You can click on as many as you want – if, for instance, you want compare the Distributions of multiple sizes, you can do that – but in general, fewer will be better.
(Our test data only has very recent data in it, so you’ll see more bars, unless of course, you are a brand new bank!)
You can also hover over any month to see the numerical levels for the chosen Items for that month.
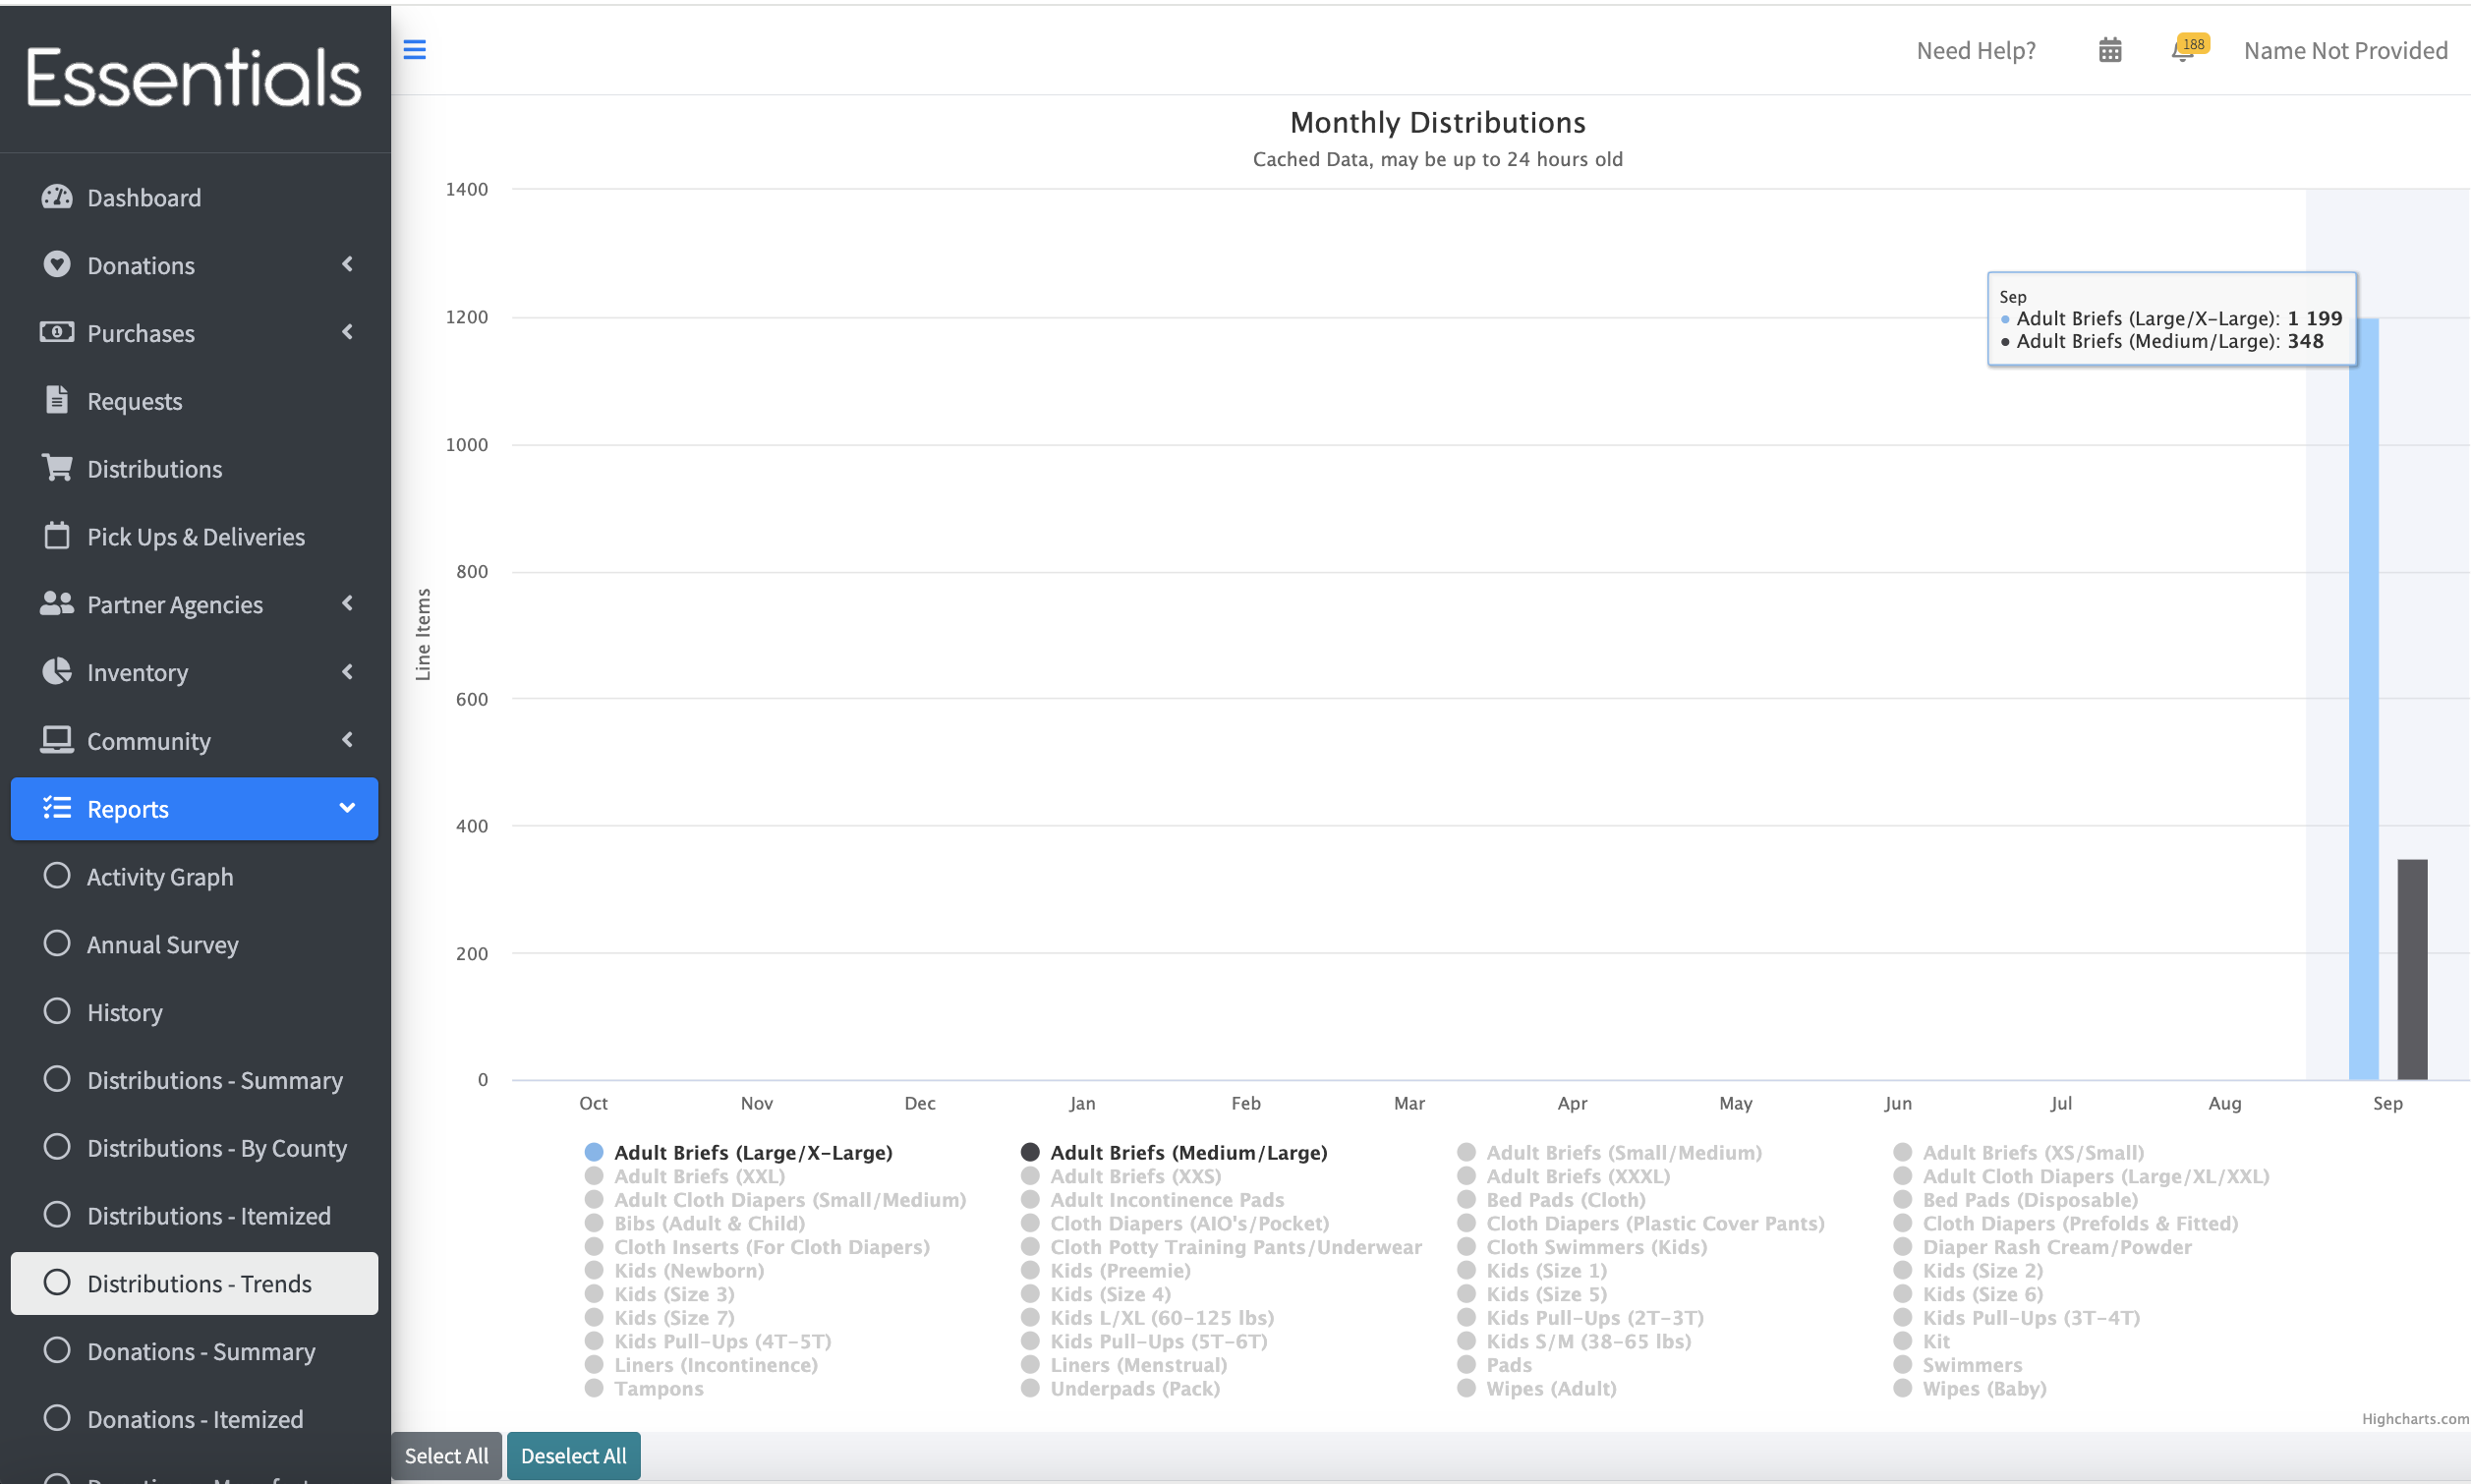
To clear the Items - either click on them again, or click “Deselect All”
You can click “Select All” to see all the Items. That will produce a very busy visual, indeed.