Activity Graph Report
This report is merely a visual representation of the number of Items processed over a time period.
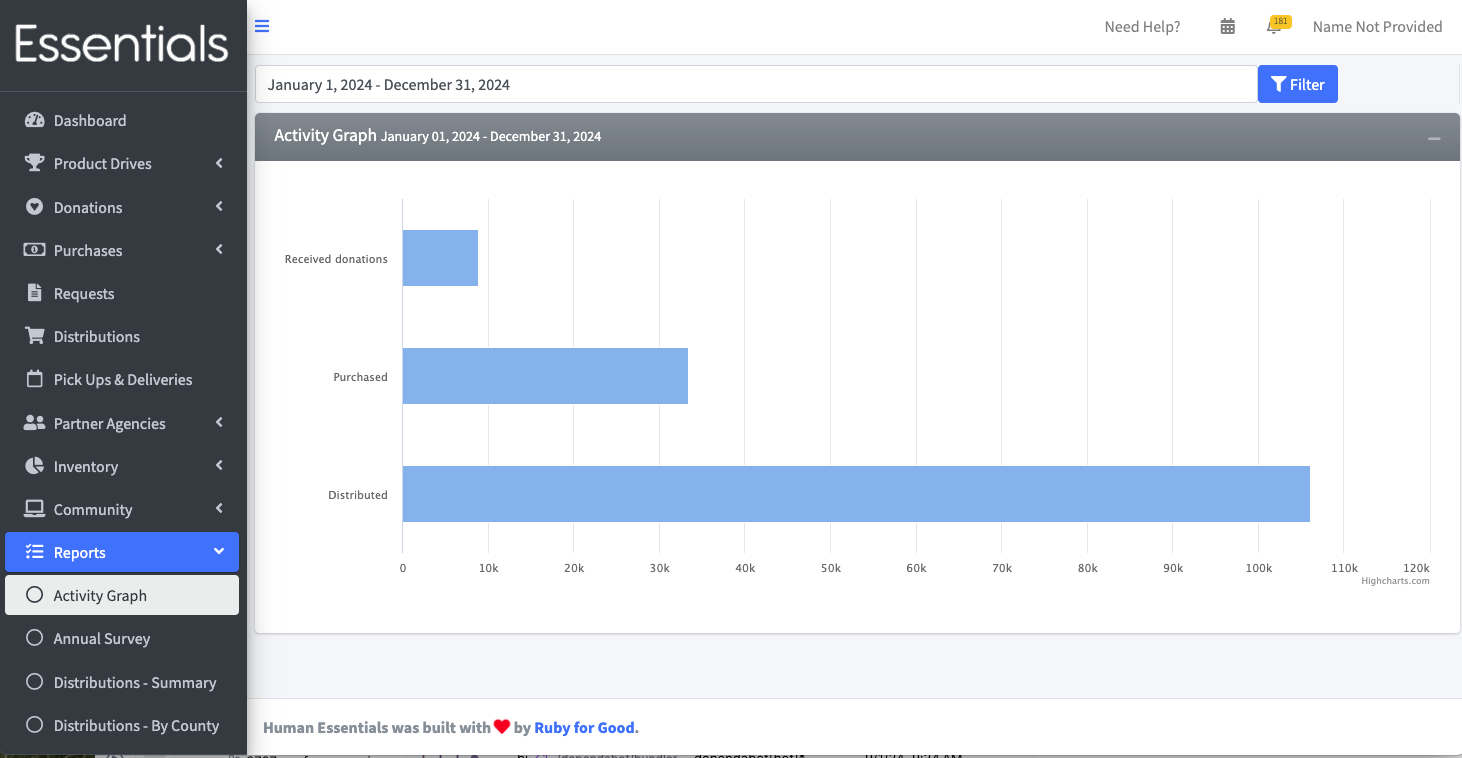
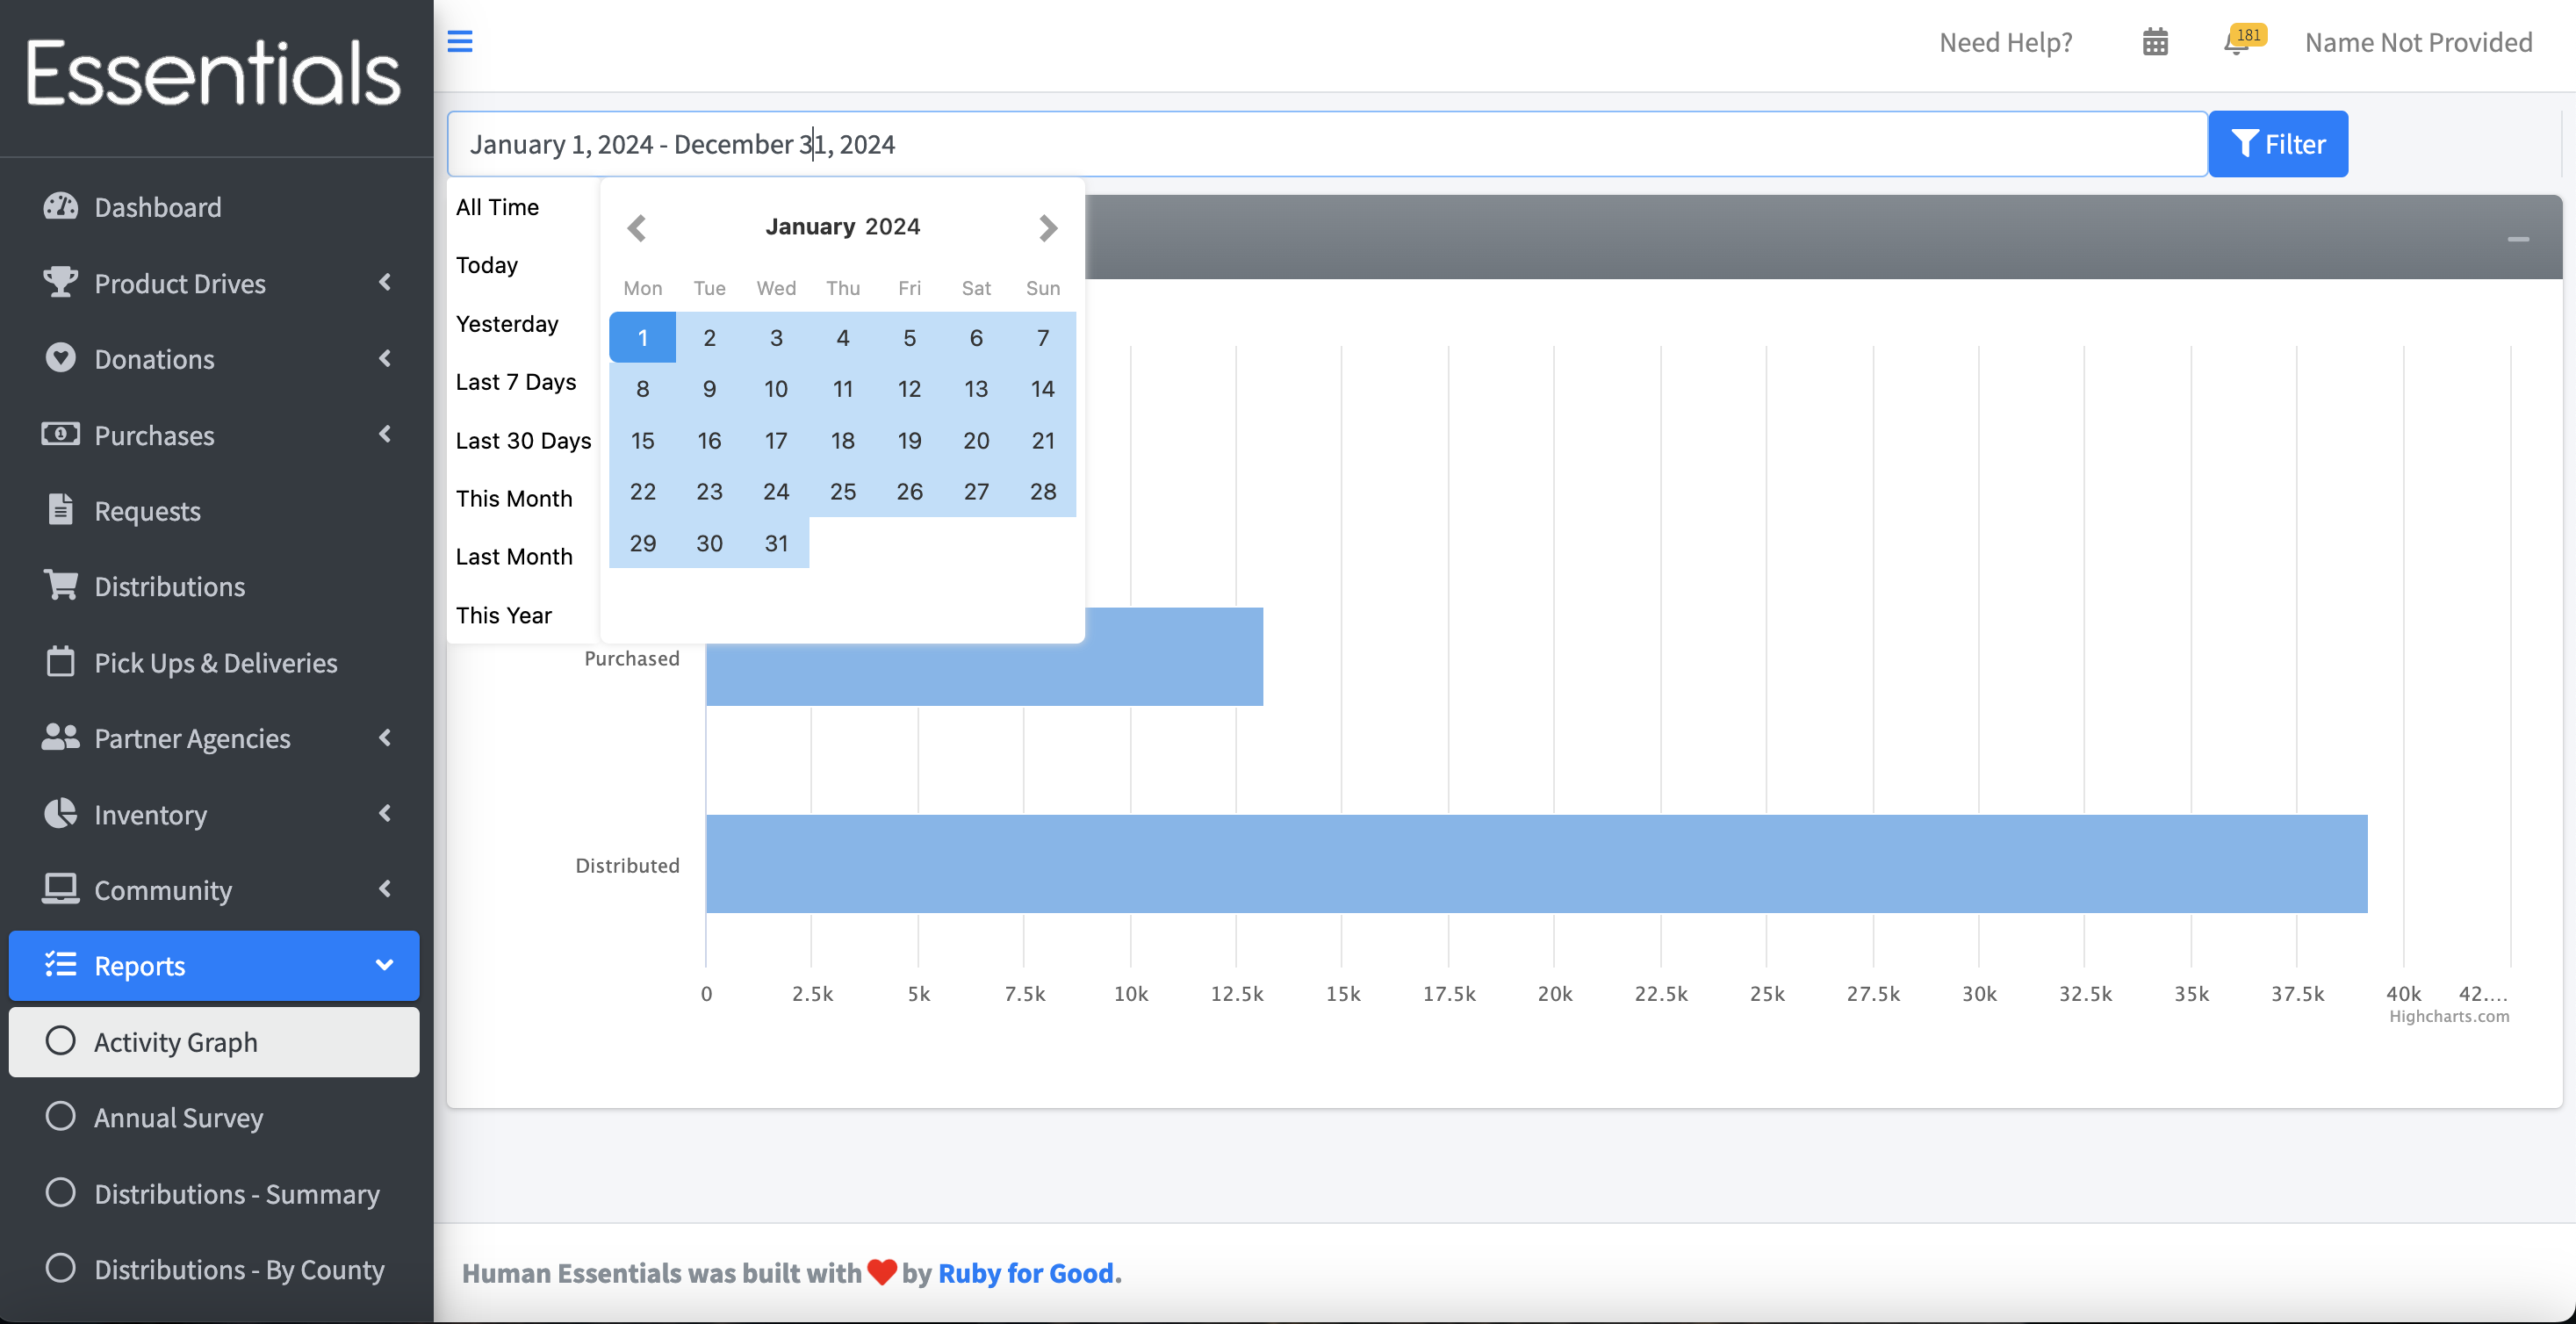
If you want to see a time period other than the default period of 60 days prior to 30 days forward from today, change the date range and click “Filter”. Note, we recommend you use the little pop-up gizmo to enter your date range, as the format of the date range is very fussy.